Data is Beautiful
coys25
•
1 year ago
•
97%
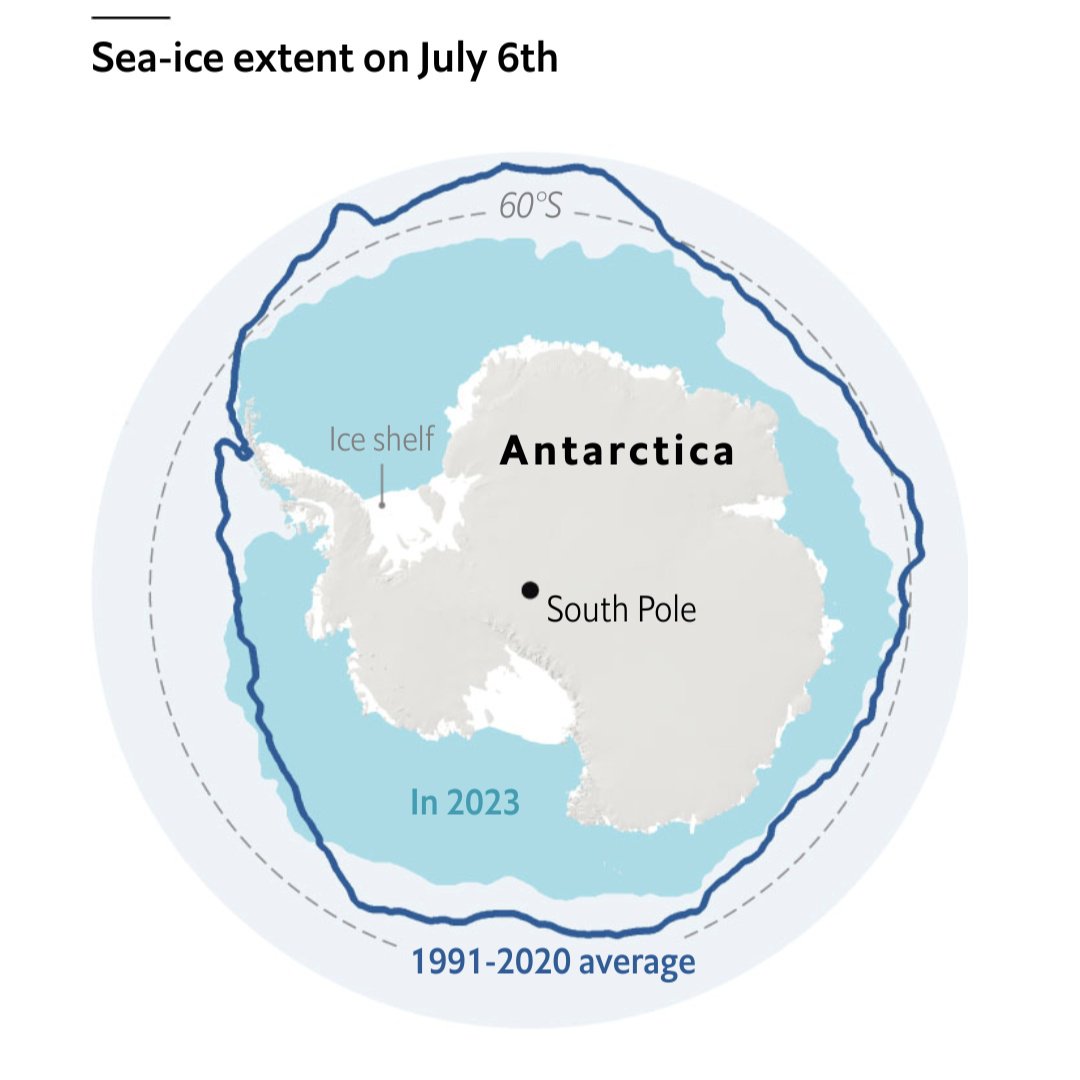
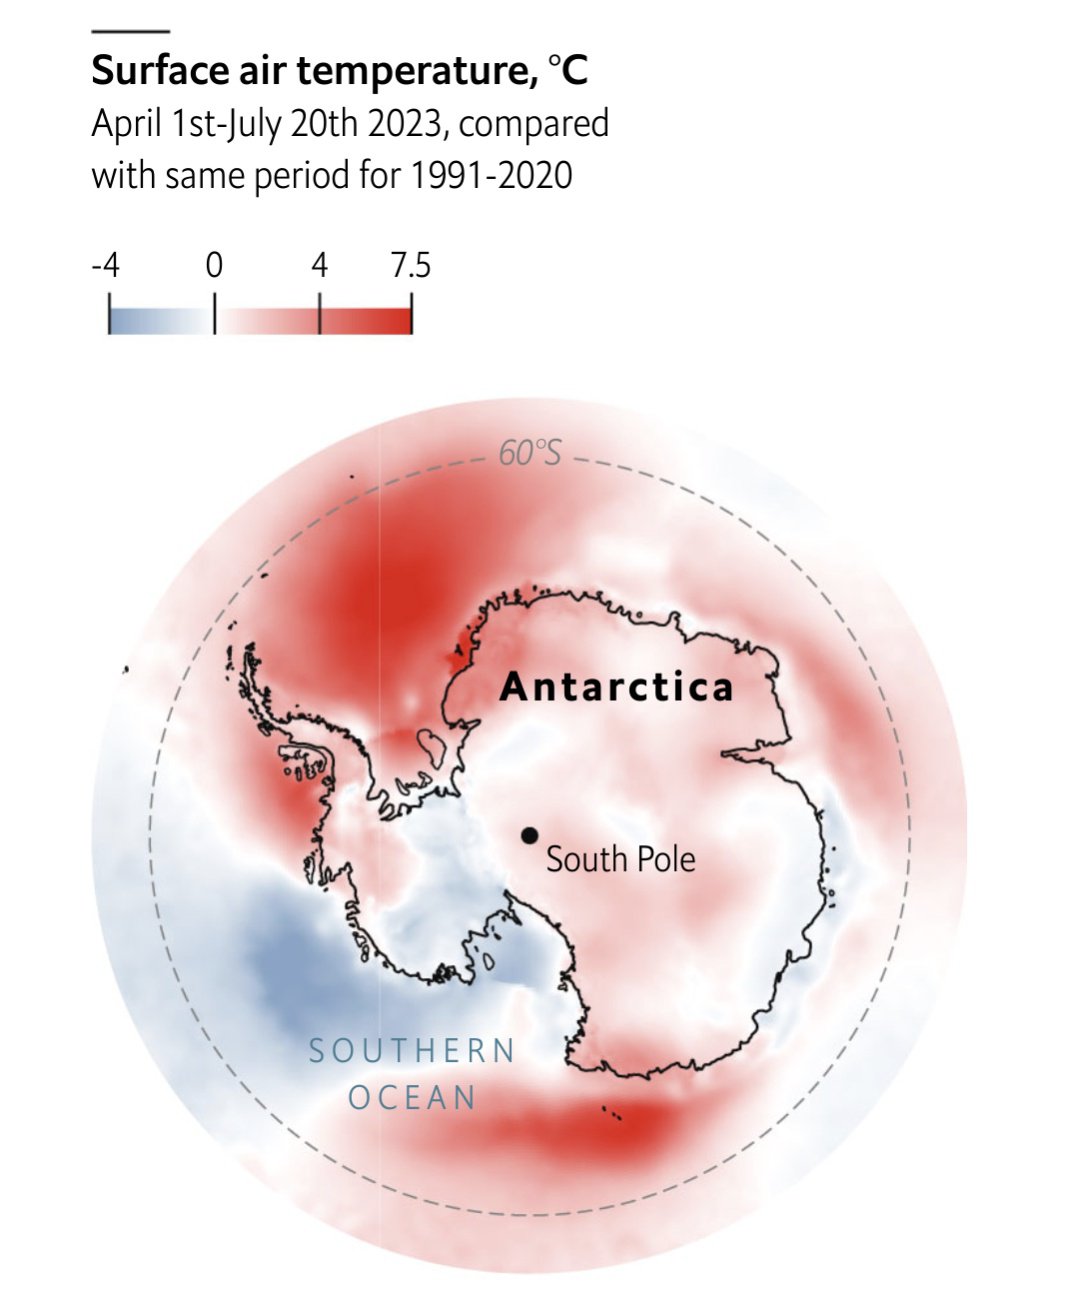
Antarctic Sea Ice Extent, 1972-present

That 2023 line does not look ideal...
Source: The Economist
Each point represents a five day moving average. The x-axis is in terms of historical standard deviations, i.e each day is compared to the standard deviation of historical values for that year. So we are at -6 SD from the historical average for this point in time.
Other excellent visualizations are in the article!


Comments 13