Data is Beautiful
kersploosh
•
8 months ago
•
85%
US energy generation by source in various regions
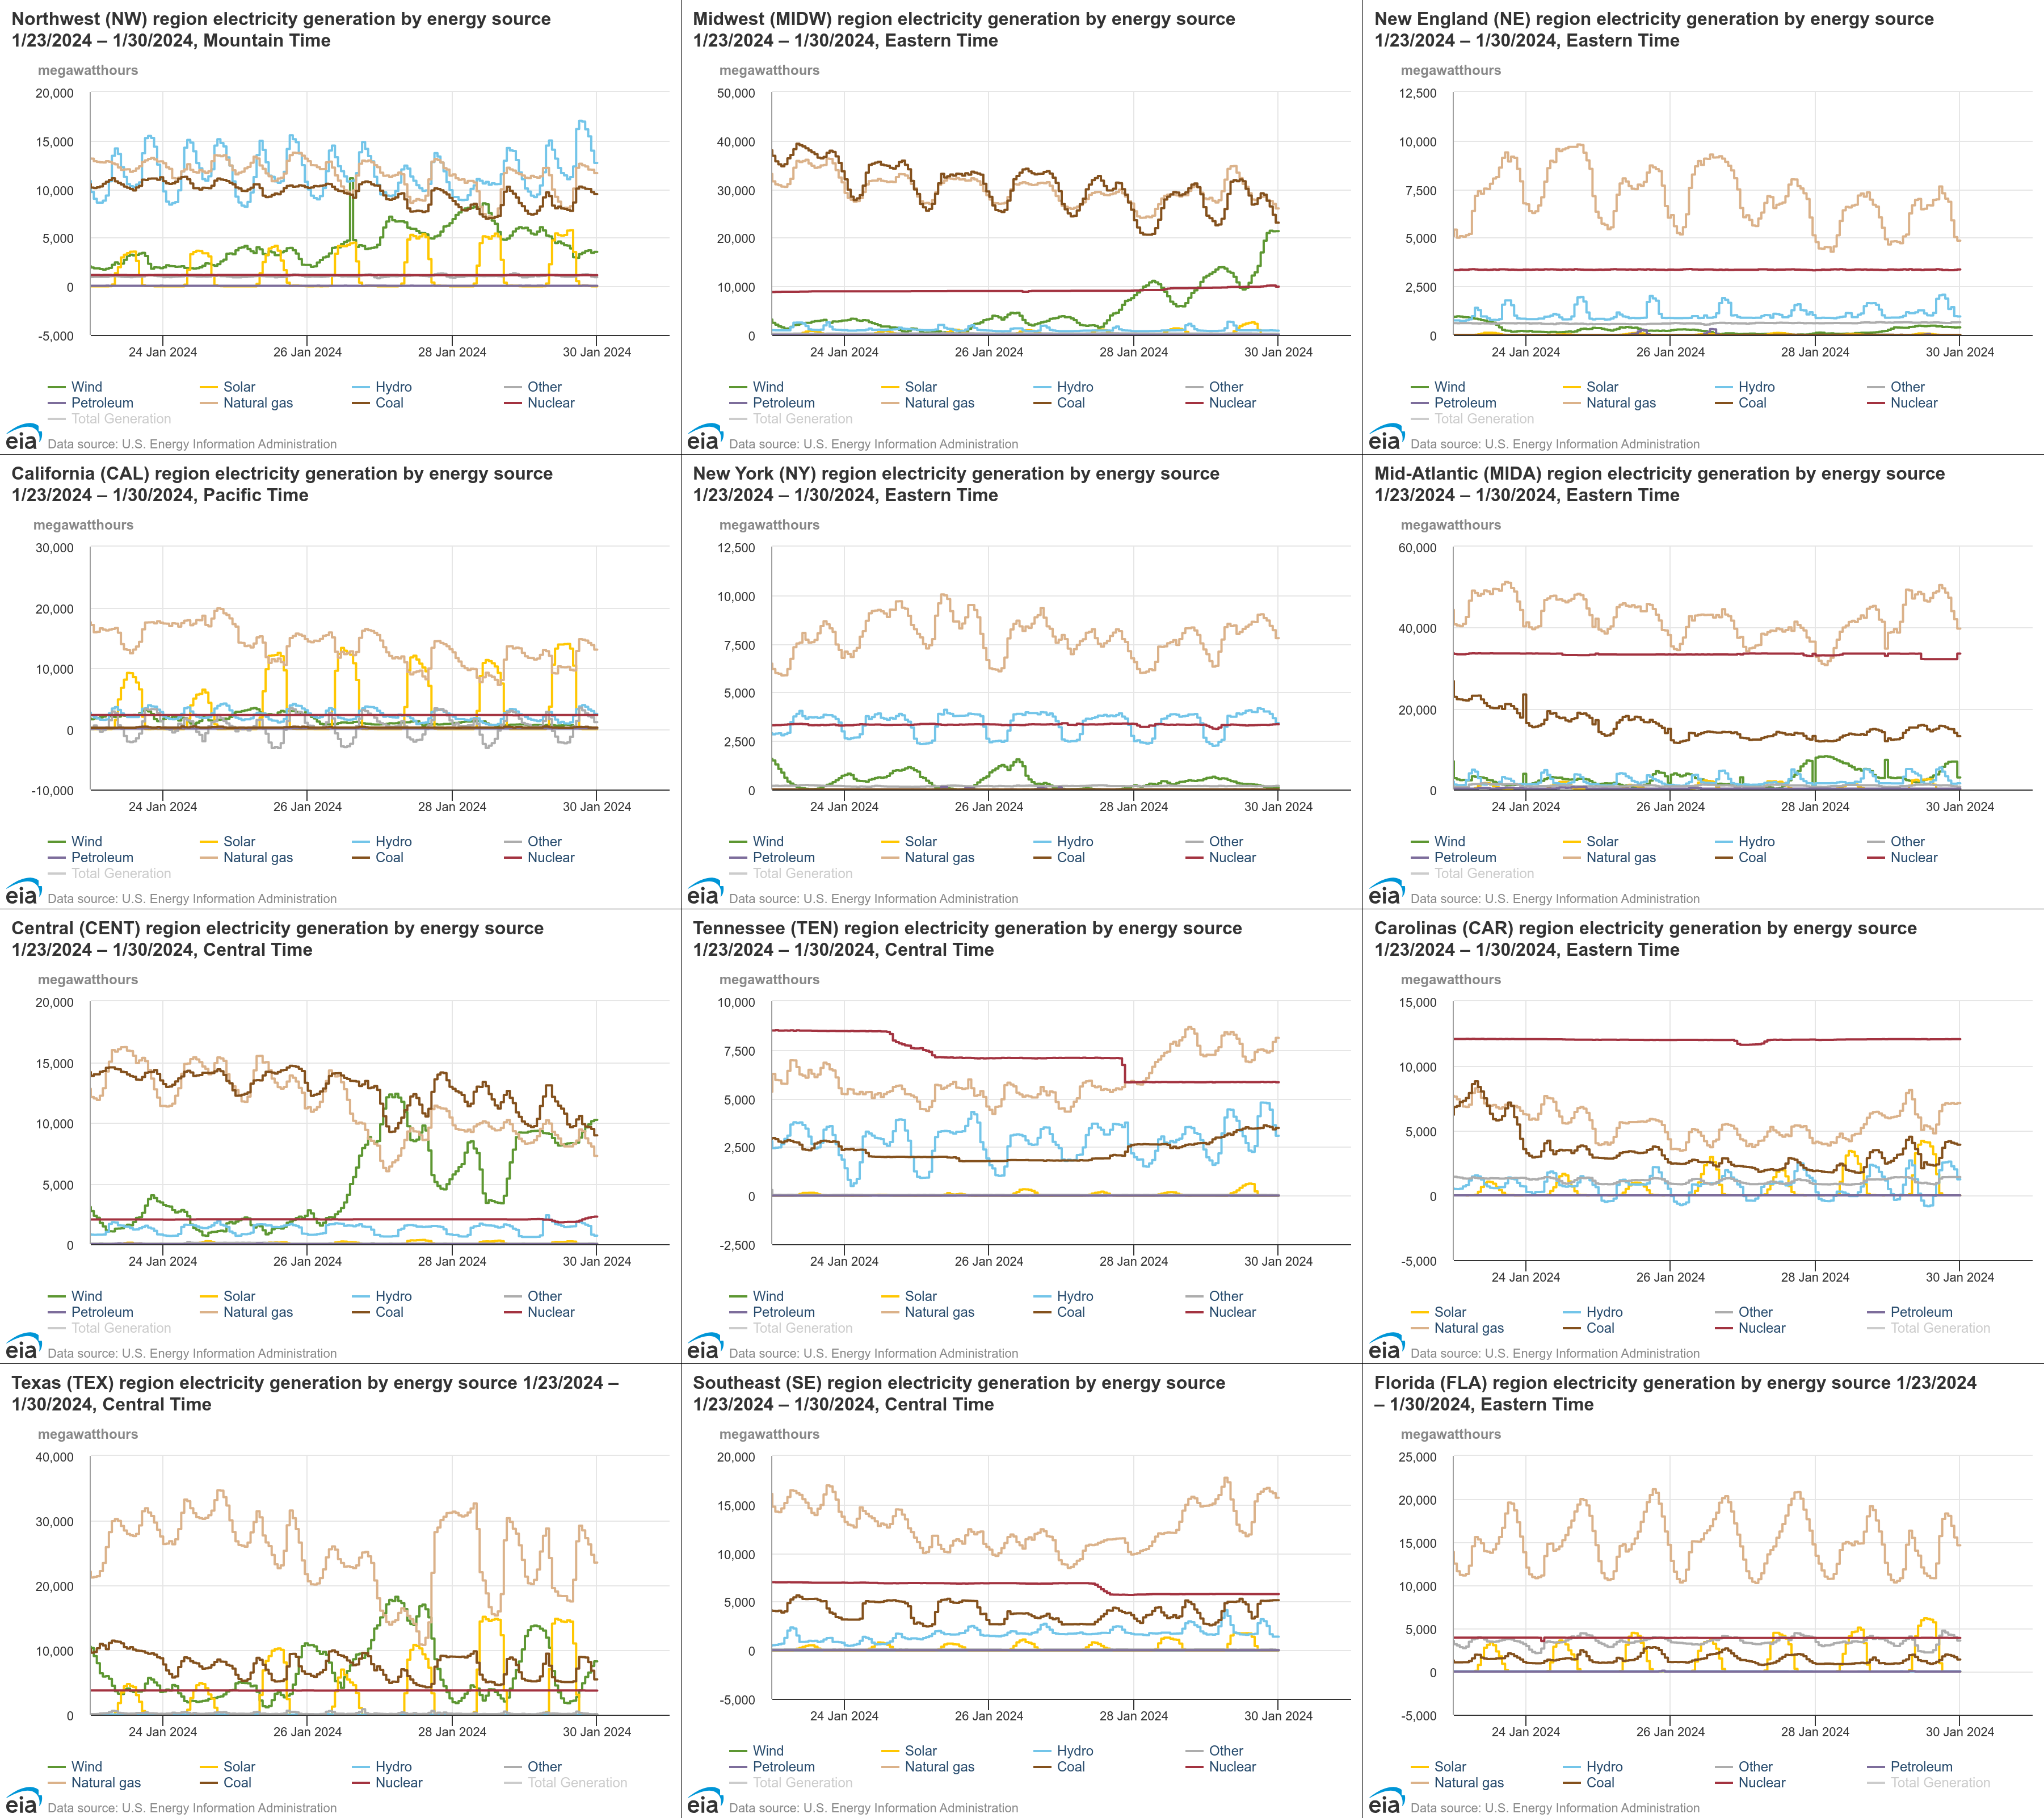
The graphs are from the US Energy Information Administration's Hourly Electric Grid Monitor:
https://www.eia.gov/electricity/gridmonitor/dashboard/electric_overview/US48/US48
The date format in the titles is month/day/year, but in the horizontal axes it's day-month-year. I apologize in advance.
Comments 1